P Wave Morphology: Difference between revisions
| Line 31: | Line 31: | ||
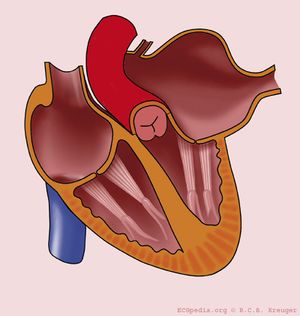
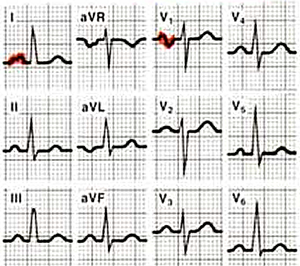
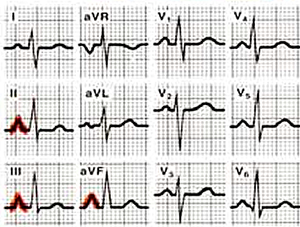
[[Image:LAE_2.png|thumb| Left atrial enlargement with ECG.]] | [[Image:LAE_2.png|thumb| Left atrial enlargement with ECG.]] | ||
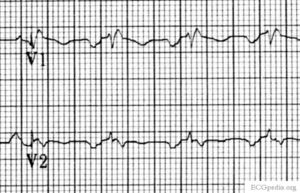
[[Image:ECG_LAtrD_v1.jpg|thumb| Left atrial enlargement as seen in lead V1.]] | [[Image:ECG_LAtrD_v1.jpg|thumb| Left atrial enlargement as seen in lead V1.]] | ||
Left atrial enlargement is often seen in mitral valve insufficiency, resulting in backflow of blood from the left ventricle to the left atrium and subsequent incresed local pressure. | |||
{{clr}} | {{clr}} | ||
Revision as of 17:10, 20 May 2007
Some statements may be disputed, incorrect or biased. |
| Author(s) | J.S.S.G. de Jong, MD | |
| Moderator | J.S.S.G. de Jong, MD | |
| Supervisor | ||
| some notes about authorship | ||
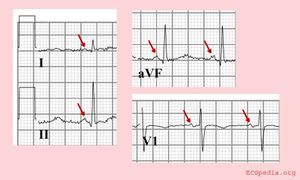
The p wave morphology can reveal right or left atrial stretch.
The P-wave morphology is best determined in leads II and V1 during sinus rhythm.
The normal P wave
Characteristics of a normal p wave:[1]
- The maximal height of the P wave is 2.5 mm in leads II and / or III
- The p wave is positive in II and AVF, and bifasic in V1
- The p wave duration is usually shorter than 0.12 seconds
Elevation or depression of the PTa segment (the part between the p wave and the beginning of the QRS complex) can result from Atrial infarction or pericarditis.
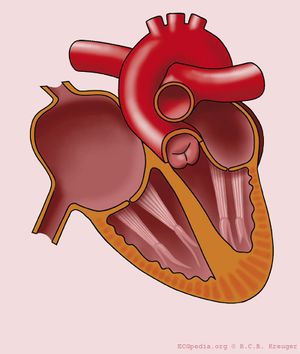
If the p-wave is enlarged, the atria are enlarged.
Left atrial enlargement
- Criteria for left atrial voor left atrial enlargement. Either
- P wave with a broad (>0,04 sec or 1 small square) and deeply negative (>1 mm) terminal part in V1
- P wave duration >0,12 sec in laeds I and / or II
Left atrial enlargement is often seen in mitral valve insufficiency, resulting in backflow of blood from the left ventricle to the left atrium and subsequent incresed local pressure.
Right atrial enlargement
- Right atrial enlargement is defined as either
- P >2,5 mm in II / III and / or aVF
- P >1,5 mm in V1.
Right atrial enlargement can result from increased pressure in the pulmonary artery, e.g. after pulmonary embolisation. A positive part of the biphasic p-wave in lead V1 larger than the negative part indicates right atrial enlargement. The width of the p wave does not change.
Biatriale belasting
Bifasische P in V1 > 0.04 sec, positief initieël deel >1.5mm en een negatief terminaal deel > 1mm
Biatriale belasting vertoont op het ECG tekenen van zowel rechter- als linkeratriumhypertrofie. V1 laat een groot eerste deel van de bifasische P-top en een diep breed tweede deel van de bifaische P-top zien.
Referenties
- Spodick DH, Raju P, Bishop RL, and Rifkin RD. Operational definition of normal sinus heart rate. Am J Cardiol. 1992 May 1;69(14):1245-6. DOI:10.1016/0002-9149(92)90947-w |
<analytics uacct="UA-807577-6"></analytics>
