QRS axis
| «Step 3: Conduction (PQ, QRS, QT, QTc) | Step 5: P wave morphology» |
| Author(s) | I.A.C. van der Bilt, MD | |
| Moderator | T.T. Keller | |
| Supervisor | ||
| some notes about authorship | ||
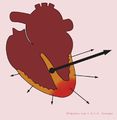
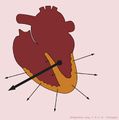
Click and drag the arrow in the above animation to change the heart axis and see how the ECG changes. The electrical heart axis is an average of all depolarizations in the heart. The depolarization wave begins in the right atrium and proceeds to the left and right ventricle. Because the left ventricle wall is thicker than the right wall, the arrow indicating the direction of the depolarization wave is directed to the left.
For a lot of people, this is a difficult concept. The theoretical part seems difficult, but in working with it, the reader will find it becoming clearer.
How do you determine the electrical heart axis


When you average all electrical signals from the heart, you can indicate the direction of the average electrical depolarization with an arrow (vector). This is the heart axis. A change of the heart axis or an extreme deviation can be an indication of pathology. To determine the heart axis you look at the extremity leads only (not V1-V6). If you focus especially on leads I, II, and AVF you can make a good estimate of the heart axis. An important concept in determining the heart axis is the fact that electricity going towards a lead yields a positive deflection in the electric recording of that lead. Imagine the leads as cameras looking at the heart. Lead I looks horizontally from the left side. Lead II looks from the left leg. Lead III from the right leg and lead AVF from below towards the heart. A positive deflection here is defined as the QRS having a larger 'area under the curve' above the baseline than below the baseline. With these basics in mind, one can easily estimate the heart axis by looking at leads I and AVF:
- Positive (the average of the QRS surface above the baseline) QRS deflection in lead I: the electrical activity is directed to the left (of the patient)
- Positive QRS deflection in lead AVF: the electrical activity is directed down.
This indicates a normal heart axis. Usually, these two leads are enough to diagnose a normal heart axis! A normal heart axis is between -30 and +90 degrees.
- A left heart axis is present when the QRS in lead I is positive and negative in II and AVF. (between -30 and -90 degrees)
- A right heart axis is present when lead I is negative and AVF positive. (between +90 and +180)
- An extreme heart axis is present when both I and AVF are negative. (axis between +180 and -90 degrees). This is a rare finding.
The largest vector in the heart is from the AV-node in the direction of ventricular depolarization. Under normal circumstances, this is directed left and down.(towards leads I and AVF). The position of the QRS vector is given in degrees. See the figure. A horizontal line towards the left arm is defined as 0 degrees.
An iso-electric lead can help estimate the heart axis more precisely:
- Iso-electric
- When the depolarization is perpendicular on the lead, this is called iso-electric. The QRS is neither positive nor negative.
- Undetermined axis
- When all extremity leads are biphasic, the axis is directed to the front or back, in a transverse plane. The axis is than undetermined.
Abnormal heart axis
-
 Heart axis deviation to the left in case of an inferior infarct. Left anterior hemiblock is a common cause. A left axis is between -30 and -90 degrees. The axis is -30 degrees.
 -
 Heart axis deviation to the right in right ventricular load, as in COPD or pulmonary embolism. A right axis is between +90 and +180 degrees. In this case the axis is +135 degrees


The direction of the vector can changes under different circumstances:
- When the heart itself is rotated (right ventricular overload), obviously the axis turns with it.
- In case of ventricular hypertrophy, the axis will deviate toward the greater electrical activity and the vector will turn toward the hypertrophied tissue.
- Infarcted tissue is electrically dead. No electrical activity is registered and the QRS vector turns away from the infarcted tissue
- In conduction problems, the axis deviates too. When the right ventricle depolarizes later than the left ventricle, the axis will turn to the right (RBBB). This is because the right ventricle will begin the contraction later and therefore will also finish later. In a normal situation the vector is influenced by the left ventricle, but in RBBB only the right ventricle determines it.
Left axis deviation


Causes of left axis deviation include:
- Normal variation (physiologic, often with age)
- Mechanical shifts, such as expiration, high diaphragm (pregnancy, ascites, abdominal tumor)
- Left ventricular hypertrophy
- Left bundle branch block
- left anterior fascicular block
- Congenital heart disease (e.g. atrial septal defect)
- Emphysema
- Hyperkalemia
- Ventricular ectopic rhythms
- Preexcitation syndromes
- Inferior myocardial infarction
- Pacemaker rhythm
Right axis deviation


Causes of right axis deviation include:
- Normal variation (vertical heart with an axis of 90º)
- Mechanical shifts, such as inspiration and emphysema
- Right ventricular hypertrophy
- Right bundle branch block
- Left posterior fascicular block
- Dextrocardia
- Ventricular ectopic rhythms
- Preexcitation syndromes
- Lateral wall myocardial infarction
- Right ventricular load, for example Pulmonary Embolism or Cor Pulmonale (as in COPD)