Myocardial Infarction
Some statements may be disputed, incorrect or biased. |
Myocardial Ischemia
Ischemia occurs when part of the heartmuscle, the myocardium, is deprived form oxygen and nutrients. Common causes of ischemia are:
- Narrowing or obstruction of a coronary artery.
- A fast rhythm disturbance, causing a disbalance in supply and demand of energy.
A short period of ischemia causes reversibele effects: The heartcells will be able to recover. When the ep[isode of ischemia lasts for a longer period of time, heartmuscle cells will die. This is called a heart attack or myocardial infarction. That is why it is critical to recognize ischemia on the ECG in an early stage.
Severe ischemia will reuslts in ECG changes within minutes. While the ischemia lasts, several ECG changes will occur and disappear again. Therefore, it may be difficult to estimate the duration of the ischemia on the ECG, which is crucial for adequate treatment.
Signs and symptoms of myocardial ischemia:
- Crushing pain on the chest (angina pectoris), behind the sternum, often radiating to the lower jaw or the left arm
- Fear of dying
- Nausea
- Shock (manifesting as paleness, low blood pressure, fast weak pulse) shock
- Rhythm dysturbances (in particular increasing prevalnce of ventricular ectopia, ventricular tachycardia, AV block)
Risk assessment of ischemia
The narrowing of the coronary artery leading to a myocardial infarction, usually develops over several years. An increased risk of myocardial infarction can be estimated using SCORE system which is developed by the European Society of cardiology (ESC). As shown in the figue, the most important risk factors for myocardial infarction are:
- Male sexe
- Smoking
- Hypertension
- Diabetes Mellitus
- Hypercholesterolemia
An exercise test such as a bicycle or treadmilltest, may be usefull in detecting myocardial ischemia after exercise.accexercise In such a test, a continuous ECG registration is performed during exercise. The ST-segment, blood pressure asnd clinical status of the patient (i.e. chest complaints) are monitorered during and after the test.
An excersize test is positive for myocardial ischemia when the following criteria are met:
- Horizontal or downsloping ST-depression of > 1mm, 60 or 80ms after the J-point
- ST elevation of > 1.0 mm
Diagnosis of myocardial infarction
The diagnosis of acute myocardial infarction is not only based on the ECG. A myocardial is defined as:Alpert
- Heartenzymes (CKMB or Troponin T) are elevated in the blood AND
- One of the following criteria are met:
- The patient has typical complaints
- The ECG shows ST elevation or depression
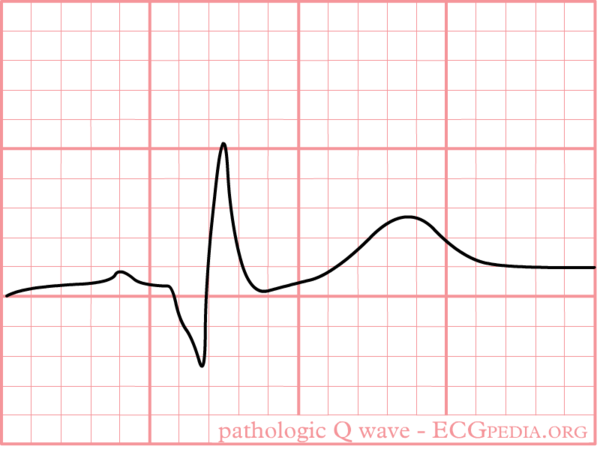
- pathological Q waves develop on the ECG
- A coronary intervention had been performed (such as stent placement)
So detection of elevated serum heartenzymes is more important than ECG changes. However, the heartenzymes can only be detected in the serum 5-7 hours after the onset of the myocardial infarction. So especially in the first few hours after the myocardial infarction the ECG can be very usefull.
Development of the ECG during persistent ischemia


The cardiomyocytes in the subendocardial layers are especcially vulnerable for a decreased perfusion. Subendocardial ischemia manifests as ST depression and is usually reversible. In a myocardial infarction transmural ischemia develops.
In the first hours and days after the onset of a myocardial infarction, several changes can be observed on the ECG. First, large peaked T waves (or hyperacute T waves), then ST elevation, thennegative T waves and finally pathological Q waves develop.
| see figure | change | |
|---|---|---|
| minutes | not in figure
b |
hyperacute T waves (peaked T waves)
ST-elevation |
| hours | c
d |
ST-elevation, with terminal negative T wave
negative T wave (these can last for months) |
| days | e | pathological Q waves |
The location of the infarct


The heartmuscle itself is very limited in its capacity to extract oxygen in the blood that is being pumped. Only the inner layers (the endocardium) profit from this oxygenrich blood. The outer layers of the heart (the epicardium) are dependent on the coronary arteries for the supply of oxygen and nutrients. With aid of an ECG, the occluded coronary can be identified. This is valuable information for the clinician, because treatment and complications of for instance an anterior wall infarction is different than those of an inferior wall infarction. The anterior wall performs the main pump function, and decay of the function of this wall will lead to decrease of bloodpressure, increase of heartrate, shock and on a longer term: heart failure. An inferior wall infarction is often accompanied with a decrease in heartrate because of involvement of the sinusnode. Longterm effects of an inferior wall infarction are usually less severe than those of an anterior wall infarction.
The heart is supplied of oxygen and nutrients by the right and left coronary arteries.The left coronray artery(the Mainstem or LM, left main) divides itself in the left anterior descending artery (LAD) and the ramus circumflexus (RCX). The right coronary artery (RCA) connects to the ramus descendens posterior (RDP). With 20% of the normal population the RDP is supplied by the RCX. This called left dominance.
Below you can find several different types of myocardial infarcation.
| localisation | ST elevation | Reciproke ST depression | coronary artery |
|---|---|---|---|
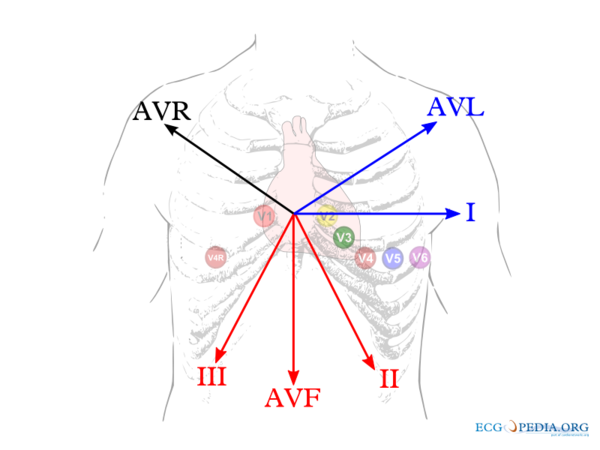
| anterior wall (anterior) | V1-V6 | None | LAD |
| septal | V1-V4, disappearance of septum Q in leads V5,V6 | none | LAD |
| lateral | I, aVL, V5, V6 | II,III, aVF | RCX or MO |
| inferior (inferior) | II, III, aVF | I, aVL | RCA (80%) or RCX (20%) |
| posterior (posterior) | V7, V8, V9 | high R in V1-V3 with ST depression V1-V3 > 2mm (mirror view) | RCX |
| right ventricle | V1, V4R | I, aVL | RCA |
The localisation of the occlusion can be adequately visualized using a coronary angiogram (CAG). On the CAG report, the place of the occlusion is often graded with a number (for example LAD(7)) using the classification of the American Heart Association.AHACAG
Anterior wall
ECG-characteristics:Wung
ST-elevation in leads V1-V6, I and aVL. Maximum elevation in V3, maximal depression in III
later: pathological Q-wave in the precordial leads V2 to V4-V5.


Encomprises the anterior part of the heart and a part of the ventricular septum. Is supplied by blood by the LAD.
Septal
QS in V1 and V2. Later the septum-Q in V5 and V6 disappears. Encomprises the ventricular septum which is supplied of blood by the septal branches of the LAD.
Lateral
ST elevation in I, aVL, V5 and V6
Encomprises the lateral side of the left ventricle. This is supplied with blood by the RCX or the MO. The MO, the marginalis obtusis is a sidebranch between the LAD and the RCX. In case of a lateral infarct, the maximal ST elevation is in lead V7 and the maximal depression in V2. Wung
Antero-lateral

ST-elevation in the precordial leads V2-V6
Later, negative T waves and Q-waves have developed in I, aVL, V5 en V6.
Inferior wall
ST elevation in II, III and aVF
This part of the heart muscle lies on the diaphragm and is supplied of blood bij the right coronary artery (RCA) in 8% of patients. In the remaing 20% the inferior wall is supplied by the ramus circumflexus(RCX).

An occlusion of the RCA can be distinguished of a RCX occulsuion on the ECG: in a RCA occlusion, there is ST depression in I and AvL and the ST-elevation is higher in III than in II. If the elevation is higher in II, suspect a RCX occlusion.
Posterior wall
High R-waves with ST-depression in V1-V3.

The posterior wall is usually supplied of blood by the RCA. Because no leads "look" at the posterior wall in the normal ECG, no leads show ST-elevation in case of a posterior wall infarction. The ST depressions in V1-V3 that can be observed in case of a posterior wall infarction are in fact mirrored ST elevations and the high R-waves are the Q-waves of the infarct. To be able to confirm a posterior-infarct, leads V7, V8 and V9 may be helpfull. These leads are horizontally placed from V6 to the back and do show the ST elevations of the posterior wall.
Right ventricle
ST-elevation >1 mm in lead V4 right
ST elevation in lead V1
Can be seen after a proximal occlusion of the RCA.
V4 right is located at the same place as lead V4, but is placed on the right side of the patient. This means it is placed under the right nipple instead of the left. This increases the sensitivity of detecting right ventricle infarcts.
Atrial infarct
In approximately 10% of the infractpatients, atrial infarct is suspected. An atrial infarct can manifest itself in atrial rhytmdisturbances: atrial fibrillation / atrial rhythm. Because the atria are hemodynamically of minor importance, the consequences of an atrial infarct are limited (and therfore often missed!).
On the ECG, an atrial infarct manifests by rhythmchanges and/or chnage of the P-Ta segment (sometimes calledPTA (P - atriale T) segment or PR or PQ or PTp (P - T wave of P wave) segment)Abildskov. This is the part between the P wave and the Q. The ST segment indicates an infarct in the ventricle, the P-Ta segment indicates an infarct in the atria.
Diagnostic criteria for an atrial infarct Liu:
- P-Ta elevation >0.5mm in V5 and V6 with reciprocal depression in V1 and V2
- P-Ta elevation >0.5mm in I and depression in II and III
- >1.5mm P-Ta depression in precordial leads
- >1.2mm P-Ta depression in I,II or III in combination with atrial arrhytmias
Several diagnostic criteria are in use, and this is just an example of one. An important differential diagnosis of PTa segment elevation or depression is pericarditis.
Infarct diagnosis in LBBB
Bij een LBTB is de infarctdiagnostiek heel moeilijk, omdat de ST segmenten altijd afwijkend zijn bij een LBTB. Een nieuw ontstaan linker bundeltakblok is een sterk argument dat het er sprake is van een myocardinfarct, maar vaak is er geen oud ECG voorhanden. De criteria (van Sgarbossa LBTB) die wel gebruikt kunnen worden bij een LBTB ECG zijn:
- ST elevatie > 1mm in afleidingen met een positief QRS complex (concordante ST deviatie) (score 5)
- ST depressie > 1 mm in V1-V3 (discordante ST deviatie) (score 3)
- ST elevatie > 5 mm in afleidingen met een negatief QRS complex (discordante ST deviatie) (score 2)
Bij een score-som van 3 hebben deze criteria een specificiteit van 90%.
References
<biblio>
- Wung pmid=16777513
- Liu pmid=13762787
- Abildskov pmid=13649561
- Alpert pmid=10987628
- accexercise pmid=12356646
- Menown pmid=10653675
- LBTB pmid=11265742
- AHACAG pmid=1116248
</biblio>