P Wave Morphology: Difference between revisions
Jump to navigation
Jump to search
mNo edit summary |
|||
| Line 35: | Line 35: | ||
==Examples== | ==Examples== | ||
<gallery> | <gallery> | ||
Image:Normaal ecg.jpg | Image:Normaal ecg.jpg|An example of normal sinus rhythm. | ||
Image:Nsr.jpg | Image:Nsr.jpg|Another example of normal sinus rhythm. | ||
</gallery> | </gallery> | ||
==References== | ==References== | ||
<biblio> | <biblio> | ||
#Spodick pmid=1575201 | #Spodick pmid=1575201 | ||
</biblio> | </biblio> | ||
Revision as of 03:55, 8 February 2009
| «Step 4:Heart axis | Step 6: QRS morphology» |
| Author(s) | J.S.S.G. de Jong, MD, A. Bouhiouf, Msc | |
| Moderator | J.S.S.G. de Jong, MD | |
| Supervisor | ||
| some notes about authorship | ||


The P wave morphology can reveal right or left atrial stretch or atrial arrhythmias and is best determined in leads II and V1 during sinus rhythm.
| Characteristics of a normal p wave:Spodick |
|---|
|
Elevation or depression of the PTa segment (the part between the p wave and the beginning of the QRS complex) can result from Atrial infarction or pericarditis.
If the p-wave is enlarged, the atria are enlarged.
If the P wave is inverted, it is most likely an ectopic atrial rhythm not originating from the sinus node.
Examples
-
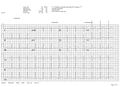 An example of normal sinus rhythm.
 -
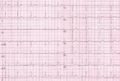 Another example of normal sinus rhythm.


References
<biblio>
- Spodick pmid=1575201
</biblio>