P Wave Morphology: Difference between revisions
Jump to navigation
Jump to search
mNo edit summary |
|||
| (5 intermediate revisions by 2 users not shown) | |||
| Line 15: | Line 15: | ||
__TOC__ | __TOC__ | ||
</div> | </div> | ||
{{clr}} | |||
==The Normal P wave== | ==The Normal P wave== | ||
{{box| | {{box| | ||
The '''P wave morphology''' can reveal right or left atrial | The '''P wave morphology''' can reveal right or left atrial hypertrophy or atrial arrhythmias and is best determined in leads II and V1 during sinus rhythm. | ||
'''Characteristics of a normal p wave:'''<cite>Spodick</cite> | '''Characteristics of a normal p wave:'''<cite>Spodick</cite> | ||
*The maximal height of the P wave is 2.5 mm in leads II and / or III | *The maximal height of the P wave is 2.5 mm in leads II and / or III | ||
*The p wave is positive in II and AVF, and | *The p wave is positive in II and AVF, and biphasic in V1 | ||
*The p wave duration is shorter than 0.12 seconds | *The p wave duration is shorter than 0.12 seconds | ||
}} | }} | ||
| Line 31: | Line 32: | ||
|} | |} | ||
</div> | </div> | ||
==The | ==The Abnormal P wave== | ||
Elevation or depression of the [[PTa segment]] (the part between the p wave and the beginning of the QRS complex) can result from [[Ischemia#Atrial infarction| | Elevation or depression of the [[PTa segment]] (the part between the p wave and the beginning of the QRS complex) can result from [[Ischemia#Atrial infarction|atrial infarction]] or [[Clinical Disorders#Pericarditis|pericarditis]]. | ||
If the p-wave is enlarged, the [[Chamber_Hypertrophy_and_Enlargment#Left_atrial_enlargement|atria are enlarged]]. | If the p-wave is enlarged, the [[Chamber_Hypertrophy_and_Enlargment#Left_atrial_enlargement|atria are enlarged]]. | ||
| Line 44: | Line 45: | ||
{| | {| | ||
|- | |- | ||
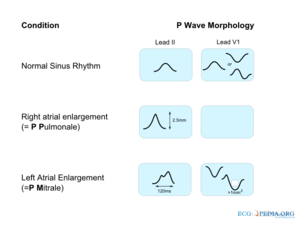
| | [[Image:p_wave_morphology.png|center|thumb|300px|Altered P wave | | | [[Image:p_wave_morphology.png|center|thumb|300px|Altered P wave morphology is seen in left or right atrial enlargement.]] | ||
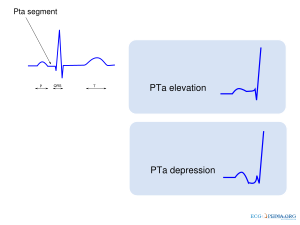
| | [[Image:pta_changes.svg|thumb|center|300px|The PTa segment can be used to diagnose pericarditis or atrial infarction.]] | | | [[Image:pta_changes.svg|thumb|center|300px|The PTa segment can be used to diagnose pericarditis or atrial infarction.]] | ||
|} | |} | ||
Latest revision as of 08:39, 12 January 2011
| «Step 4:Heart axis | Step 6: QRS morphology» |
| Author(s) | J.S.S.G. de Jong, MD, A. Bouhiouf, Msc | |
| Moderator | J.S.S.G. de Jong, MD | |
| Supervisor | ||
| some notes about authorship | ||
The Normal P wave
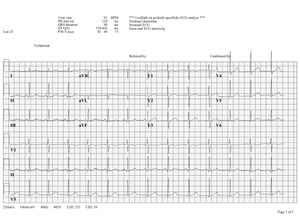
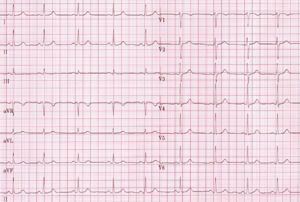
The P wave morphology can reveal right or left atrial hypertrophy or atrial arrhythmias and is best determined in leads II and V1 during sinus rhythm.
Characteristics of a normal p wave:Spodick
- The maximal height of the P wave is 2.5 mm in leads II and / or III
- The p wave is positive in II and AVF, and biphasic in V1
- The p wave duration is shorter than 0.12 seconds
The Abnormal P wave
Elevation or depression of the PTa segment (the part between the p wave and the beginning of the QRS complex) can result from atrial infarction or pericarditis.
If the p-wave is enlarged, the atria are enlarged.
If the P wave is inverted, it is most likely an ectopic atrial rhythm not originating from the sinus node.
|
{{{1}}}


