Conduction: Difference between revisions
| (123 intermediate revisions by 12 users not shown) | |||
| Line 3: | Line 3: | ||
|previousname=Step 2: Rate | |previousname=Step 2: Rate | ||
|nextpage=Heart axis | |nextpage=Heart axis | ||
|nextname=Step 4: Learn how to determine the heart axis | |nextname=Step 4: Learn how to determine the heart's conduction axis | ||
}} | }} | ||
{{authors| | |||
|mainauthor= [[user:Drj|J.S.S.G. de Jong, MD]] | |||
|moderator= [[J.S.S.G. de Jong]] | |||
|supervisor= | |||
}} | |||
<div style="float:left">__TOC__</div> | |||
{{clr}} | |||
[[Image:QRSwaves.jpg|thumb|300px|right]] | |||
==The PQ interval== | |||
[[Image:Conduction_ap.svg|thumb|300px|right|The PQ duration depends on the conduction velocity in the atria, AV node, His bundle, bundle branches and Purkinje fibers]] | |||
'''The PQ interval starts at the beginning of the atrial contraction and ends at the beginning of the ventricular contraction.''' | |||
The PQ interval (sometimes referred to as the PR interval as a Q wave is not always present) indicates how fast the action potential is transmitted through the AV node (atrioventricular) from the atria to the ventricles. Measurement should start at the beginning of the P wave and end at the beginning of the QRS segment. | |||
The PQ interval | '''The normal PQ interval is between 0.12 and 0.22 seconds'''. | ||
A prolonged PQ interval is a sign of a degradation of the conduction system or increased vagal tone (Bezold-Jarisch reflex), or it can be pharmacologically induced. | |||
This is called [[Arrhythmias#Atrioventricular_block|1st, 2nd or 3rd degree AV block]]. | |||
A short PQ interval can be seen in the [[Arrhythmias#WPW_syndrome|WPW syndrome]] in which | A short PQ interval can be seen in the [[Arrhythmias#WPW_syndrome|WPW syndrome]] in which faster-than-normal conduction exists between the atria and the ventricles. | ||
==The QRS duration== | ==The QRS duration== | ||
'''The QRS duration indicates how fast the ventricles depolarize. The normal QRS is < 0.10 seconds''' | |||
The ventricles depolarize normally within 0.10 seconds. When this is longer than 110 miliseconds<cite>aha</cite>, this is a [[conduction delay| conduction delay]]. Possible causes of a QRS duration > 110 miliseconds include: | |||
* [[LBBB|Left bundle branch block]] | |||
* [[RBBB|Right bundle branch block]] | |||
* [[Electrolyte Disorders]] | |||
* [[Idioventricular Rhythm|Idioventricular rhythm]] and [[Pacemaker|paced rhythm]] | |||
For the diagnosis of LBBB or RBBB QRS duration must be >120 ms. | |||
==The QT interval== | ==The QT interval== | ||
[[File:E000571.jpg|thumb|400px| The QT interval starts at the onset of the Q wave and ends where the tangent line for the steepest part of the T wave intersects with the baseline of the ECG. ]] | |||
[[File:QTeyeballing.png|thumb|400px|The eyeballing method to estimate QT prolongation. If the QT interval ends before the imaginary boundary halfway two QRS complexes, the QTc is probably normal. If the QTc reaches beyond the halfway line, the QTc is probably prolonged. This method is only 'valid' in registrations with normal (60-100/min) heart rates.]] | |||
'''The normal QTc (corrected) interval''' | |||
[[ | The QT interval indicates how fast the ventricles are repolarized, becoming ready for a new cycle. | ||
The QT interval | The normal value for QTc is: '''below 450ms for men and below 460ms for women''' as agreed upon by the ACC / HRS. <cite>aha2</cite> | ||
In a recent ACC consensus document an expert writing group suggest that in a hospital setting the upper limit be raised to the 99th percentile of normal: 470ms in males and 480 ms in females, as approximately 10% to 20% of the general population have a QTc > 440m s. For both men and women QTc > 500ms is considered highly abnormal.<cite>TdP</cite> | |||
If QTc is < 340ms [[Short_QT_Syndrome|short QT syndrome]] can be considered. | |||
[[Image:Formule_QTc.png]] | The QT interval comprises the QRS-complex, the ST-segment, and the T-wave. One difficultly of QT interpretation is that the QT interval gets shorter as the heart rate increases. This problem can be solved by correcting the QT time for heart rate using the Bazett formula: [[Image:Formule_QTc.png]] | ||
Thus at a heart rate of 60 bpm, the RR interval is 1 second and the QTc equals QT/1. The '''[[QTc calculator]]''' can be used to easily calculate QTc from the QT and the heart rate or RR interval. | |||
On modern ECG machines, the QTc is given. However, the machines are not always capable of making the correct determination of the end of the T wave. Therefore, it is important to check the QT time manually. | |||
< | Alternatives to the Bazzett correction formula are the Fridericia, Framingham and Hodges formulas. The latter two perform better at high heart rates (>100 /min). <cite>Indik</cite><cite>T</cite> | ||
*Fridericia: QTc = QT{HR/60}1/3 | |||
*Framingham: QTc = QT + 0.154{1 – (60/HR)} | |||
*Hodges: QTc = QT + 1.75 (heart rate - 60). | |||
Although QT prolongation is potentially lethal, measurement of the QT interval by physicians is not standardized, since different definitions of the end of the T wave exist.<cite>Viskin</cite> Most QT experts define the end of the T wave as the intersection of the steepest tangent line from the end of the T-wave with the base line of the ECG.<cite>Lepeschkin</cite> This leads to the following stepwise approach: | |||
The | {| class="wikitable" width="800px" | ||
!Stepwise approach to correct measurement of the QT interval | |||
|- | |||
| | |||
#Use lead II. Use lead V5 alternatively if lead II cannot be read. | |||
#Draw a line through the baseline (preferably the PR segment) | |||
#Draw a tangent against the steepest part of the end of the T wave. If the T wave has two positive deflections, the taller deflection should be chosen. If the T wave is biphasic, the end of the taller deflection should be chosen. | |||
#The QT interval starts at the beginning of the QRS interval and ends where the tangent and baseline cross. | |||
#If the QRS duration exceeds 120ms the amount surpassing 120ms should be deducted from the QT interval (i.e. QT=QT-(QRS width-120ms) ). | |||
#Calculate QTc according to Bazett: [[Image:Formule_QTc.png]]. You can use the '''[[QTc calculator]]''' for this. | |||
|} | |||
During ventricular pacing this method overestimates the QTc. The Framingham formula performs better during pacing, but still overestimates the QTc in sinus rhythm (in the same patient) by about 37-43 msec.<cite>Chiladakis</cite> | |||
In a pathological prolonged QT time, it takes longer than the normal amount of time for the myocardial cells to be ready for a new cycle. There is a possibility that some cells are not yet repolarized, but that a new cycle is already initiated. These cells are at risk for uncontrolled depolarization, induction of [[Torsade de Pointes]] and subsequent [[Ventricular Fibrillation]]. | |||
== | {| class="wikitable" width="800px" | ||
*Medication ( | ! Causes of QT prolongation | ||
* | |- | ||
* | | | ||
The QT interval is prolonged in congenital [[long QT syndrome]], but QT prolongation can also occur be acquire as a results of: | |||
* Medication (anti-arrhythmics, tricyclic antidepressants, phenothiazedes, for a complete list see [http://www.torsades.org Torsades.org] | |||
* Electrolyte imbalances | |||
* Ischemia. | |||
QT prolongation is often treated with beta blockers. | |||
|} | |||
=== | If the QT segment is abnormal, it can be difficult to define the end of the T wave. Below are a number of examples that suggest how QT should be measured in these patients. | ||
{| class="wikitable" width="800px" style="margin:5px" | |||
!colspan='3'|How to measure QT if the QT segement is abnormal | |||
|- | |||
|valign="top"|[[File:lastigeQT1.png|250px|center]] | |||
|valign="top"|[[File:lastigeQT2.png|250px|center]] | |||
|valign="top"|[[File:lastigeQT3.png|250px|center]] | |||
|- | |||
|valign="top"|<div style="margin:5px">The T wave is broad, but the tangent crosses the baseline before the T wave joins the baseline. The QT interval would be overestimated when this last definition of the end of the T wave would be used.</div> | |||
|valign="top"|<div style="margin:5px">The ECG does not meet the baseline after the end of the T wave. Still, the crossing of the tangent and baseline should be used for measurements.</div> | |||
|valign="top"|<div style="margin:5px">A bifasic T wave. The tangent to the 'hump' with the largest amplitude is chosen. This can change from beat to beat, making it more important to average several measurements.</div> | |||
|} | |||
{{box| | |||
== References == | == References == | ||
<biblio> | <biblio> | ||
#aha pmid=19228822 | |||
#bazett Bazett HC. ''An analysis of the time-relations of electrocardiograms''. Heart 1920;7:353-370. | #bazett Bazett HC. ''An analysis of the time-relations of electrocardiograms''. Heart 1920;7:353-370. | ||
#Lepeschkin pmid=14954534 | #Lepeschkin pmid=14954534 | ||
#Gaita pmid=12925462 | #Gaita pmid=12925462 | ||
# | #Moss pmid=8256751 | ||
#aha2 pmid=19228821 | |||
#Viskin pmid=15922261 | |||
#Indik pmid=16945790 | |||
#T pmid=15842424 | |||
#TdP pmid=20185054 | |||
#Chiladakis pmid=23118006 | |||
</biblio> | </biblio> | ||
}} | |||
[[Category:ECG Course]] | |||
Latest revision as of 05:29, 13 September 2021
| «Step 2: Rate | Step 4: Learn how to determine the heart's conduction axis» |
| Author(s) | J.S.S.G. de Jong, MD | |
| Moderator | J.S.S.G. de Jong | |
| Supervisor | ||
| some notes about authorship | ||
The PQ interval
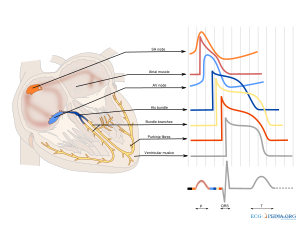
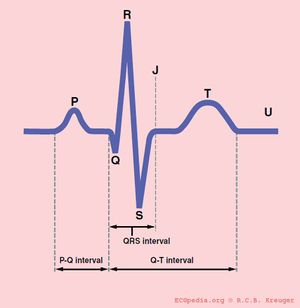
The PQ interval starts at the beginning of the atrial contraction and ends at the beginning of the ventricular contraction.
The PQ interval (sometimes referred to as the PR interval as a Q wave is not always present) indicates how fast the action potential is transmitted through the AV node (atrioventricular) from the atria to the ventricles. Measurement should start at the beginning of the P wave and end at the beginning of the QRS segment.
The normal PQ interval is between 0.12 and 0.22 seconds.
A prolonged PQ interval is a sign of a degradation of the conduction system or increased vagal tone (Bezold-Jarisch reflex), or it can be pharmacologically induced.
This is called 1st, 2nd or 3rd degree AV block.
A short PQ interval can be seen in the WPW syndrome in which faster-than-normal conduction exists between the atria and the ventricles.
The QRS duration
The QRS duration indicates how fast the ventricles depolarize. The normal QRS is < 0.10 seconds
The ventricles depolarize normally within 0.10 seconds. When this is longer than 110 milisecondsaha, this is a conduction delay. Possible causes of a QRS duration > 110 miliseconds include:
- Left bundle branch block
- Right bundle branch block
- Electrolyte Disorders
- Idioventricular rhythm and paced rhythm
For the diagnosis of LBBB or RBBB QRS duration must be >120 ms.
The QT interval
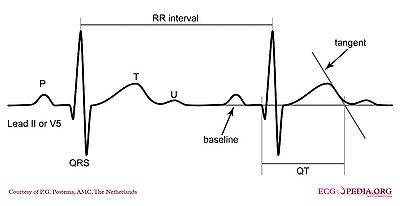

The normal QTc (corrected) interval The QT interval indicates how fast the ventricles are repolarized, becoming ready for a new cycle.
The normal value for QTc is: below 450ms for men and below 460ms for women as agreed upon by the ACC / HRS. aha2
In a recent ACC consensus document an expert writing group suggest that in a hospital setting the upper limit be raised to the 99th percentile of normal: 470ms in males and 480 ms in females, as approximately 10% to 20% of the general population have a QTc > 440m s. For both men and women QTc > 500ms is considered highly abnormal.TdP
If QTc is < 340ms short QT syndrome can be considered.
The QT interval comprises the QRS-complex, the ST-segment, and the T-wave. One difficultly of QT interpretation is that the QT interval gets shorter as the heart rate increases. This problem can be solved by correcting the QT time for heart rate using the Bazett formula: ![]()
Thus at a heart rate of 60 bpm, the RR interval is 1 second and the QTc equals QT/1. The QTc calculator can be used to easily calculate QTc from the QT and the heart rate or RR interval.
On modern ECG machines, the QTc is given. However, the machines are not always capable of making the correct determination of the end of the T wave. Therefore, it is important to check the QT time manually.
Alternatives to the Bazzett correction formula are the Fridericia, Framingham and Hodges formulas. The latter two perform better at high heart rates (>100 /min). IndikT
- Fridericia: QTc = QT{HR/60}1/3
- Framingham: QTc = QT + 0.154{1 – (60/HR)}
- Hodges: QTc = QT + 1.75 (heart rate - 60).
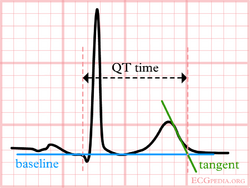
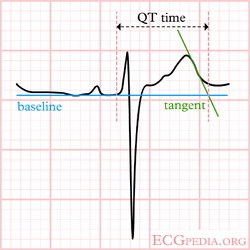
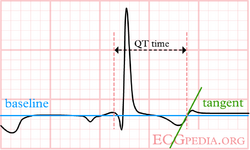
Although QT prolongation is potentially lethal, measurement of the QT interval by physicians is not standardized, since different definitions of the end of the T wave exist.Viskin Most QT experts define the end of the T wave as the intersection of the steepest tangent line from the end of the T-wave with the base line of the ECG.Lepeschkin This leads to the following stepwise approach:
| Stepwise approach to correct measurement of the QT interval |
|---|
|
During ventricular pacing this method overestimates the QTc. The Framingham formula performs better during pacing, but still overestimates the QTc in sinus rhythm (in the same patient) by about 37-43 msec.Chiladakis
In a pathological prolonged QT time, it takes longer than the normal amount of time for the myocardial cells to be ready for a new cycle. There is a possibility that some cells are not yet repolarized, but that a new cycle is already initiated. These cells are at risk for uncontrolled depolarization, induction of Torsade de Pointes and subsequent Ventricular Fibrillation.
| Causes of QT prolongation |
|---|
|
The QT interval is prolonged in congenital long QT syndrome, but QT prolongation can also occur be acquire as a results of:
QT prolongation is often treated with beta blockers. |
If the QT segment is abnormal, it can be difficult to define the end of the T wave. Below are a number of examples that suggest how QT should be measured in these patients.
{{{1}}}
