Normal Tracing: Difference between revisions
Jump to navigation
Jump to search
mNo edit summary |
No edit summary |
||
| (27 intermediate revisions by 9 users not shown) | |||
| Line 1: | Line 1: | ||
{{ | {{authors| | ||
|mainauthor= [[user:Drj|J.S.S.G. de Jong]] | |||
|moderator= [[T.T. Keller]] | |||
|supervisor= | |||
}} | |||
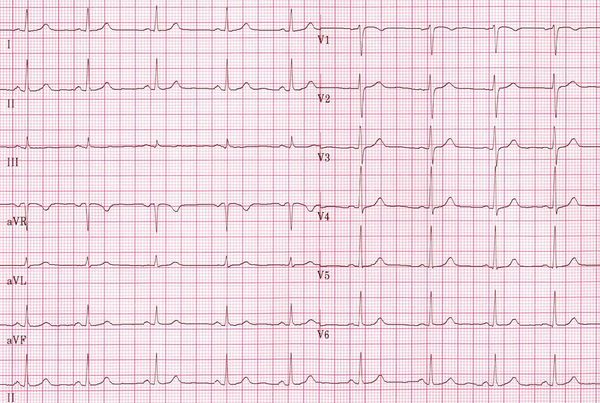
[[Image:Nsr.jpg|thumb| A normal ECG]] | |||
{| class="wikitable" | |||
!Characteristics of a normal ECG | |||
|- | |||
| | |||
* '''[[Rhythm]]''': [[Sinus node rhythms and arrhythmias|sinus]] | |||
* '''[[Rate]]''': 60-100 bpm | |||
* '''[[Conduction]]''': | |||
** [[Conduction#The PQ interval|PQ interval]] 120-200ms | |||
** [[Conduction#The QRS interval|QRS width]] 60-100ms | |||
** [[Conduction#The QT interval|QTc interval]] 390-450ms (use the [[QTc calculator]] for this) | |||
* '''[[Heart axis]]''': between -30 and +90 degrees | |||
* '''[[P wave morphology]]''': | |||
** The maximal height of the P wave is 2.5 mm in leads II and / or III | |||
** The p wave is positive in II and AVF, and biphasic in V1 | |||
** The p wave duration is usually shorter than 0.12 seconds | |||
* '''[[QRS morphology]]''': | |||
**No [[Q waves|pathological Q waves]] | |||
**No left or right ventricular [[hypertrophy]] | |||
**No [[microvoltage]] | |||
**Normal R wave propagation. (R waves increase in amplitude from V1-V5) | |||
* '''[[ST morphology]]''' | |||
**No [[ST morphology|ST elevation or depression]] | |||
**T waves should be [[ST morphology|concordant with the QRS complex]] | |||
* The ECG should not have changed from the previous ECG | |||
|} | |||
Latest revision as of 23:17, 13 December 2011
| Author(s) | J.S.S.G. de Jong | |
| Moderator | T.T. Keller | |
| Supervisor | ||
| some notes about authorship | ||

| Characteristics of a normal ECG |
|---|
|