Difficult QT: Difference between revisions
Jump to navigation
Jump to search
mNo edit summary |
|||
| (13 intermediate revisions by 2 users not shown) | |||
| Line 1: | Line 1: | ||
{{authors| | {{authors| | ||
|mainauthor= P.G. Postema, MD | |mainauthor= [[user:Pgpostema|P.G. Postema, MD]] | ||
|advisor= | |||
|coauthor= | |coauthor= | ||
|moderator= P.G. Postema, MD | |moderator= [[user:Pgpostema|P.G. Postema, MD]] | ||
|editor= [[user:Drj|J.S.S.G. de Jong, MD]] | |editor= [[user:Drj|J.S.S.G. de Jong, MD]] | ||
}} | }} | ||
__NOTOC__ | __NOTOC__ | ||
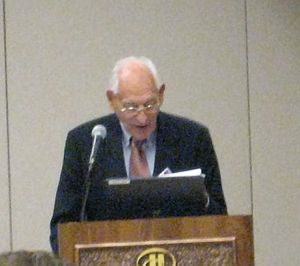
[[ | [[Image:Surawicz.jpg|thumb| Dr Surawicz, is one of the inventors of the tangent mehod<cite>Lepeschkin</cite>. This picture was taken in November 2006, when he was 89 years old and still active.]] | ||
The ST segment can present itself in many variants and sometimes this makes it difficult to determine the end of the QT interval. Here you will find some examples of 'difficult' QT segments and how the measure them. | |||
Some controversy exists among cardiologists about when the end of the T wave. Lepeschkin was the first to describe the tangent method that is described in this chapter, and which is addored by most QT specialists.<cite>Lepeschkin</cite> Others allways measure the end of the T wave where it rejoins the baseline, which will often result in longer QT intervals. | |||
=== | ===General considerations=== | ||
* | * The QT interval should be measured in lead II, because the influence of a possible U-wave are smallest in this lead. If lead II is cannot be used for measurements, than leads V4 or V5 can be used alternatively. | ||
* | * Draw a line through the baseline. This is the horizontal line between the P wave and QRS complex. If [[PTa segment]] depression is present, the T - P segment is used alternatively. If there is baseline drifting, it can be difficult to determine the proper baseline and measurements will be less accurate. | ||
* | * Draw a tangent against the steepest part of the end of the T wave. If the T wave has two humps (as in a camel back), the tallest hump should be picked. If the T wave has a positive and negative hump (or the other way around), the hump with the largest amplitude should be picked (see third example, the first hump has the largest amplitude and should be picked to draw the tangent). | ||
* | * The QT interval starts at the beginning of the QRS complex: the beginning of the first deflection (either positive of negative) of the QRS complex. | ||
* | * The QT interval ends where the tangent and the baseline cross. | ||
* | * The QT interval is the time in milliseconds between the start and end of the QT interval. | ||
* If the QRS interval exceeds 120 milliseconds, than some specialists advice to deduct the amount of milliseconds that exceed 120 ms from the QT interval (i.e. if QRS is 140 ms and QT is 480, then 20ms (i.e. 140 - 120ms) should be deducted from the QT interval, yielding 460ms). | |||
{{clr}} | {{clr}} | ||
=== | ===QTc is the heart rate corrected QT interval=== | ||
<flash>file=QTc.swf|width=300|height=200|quality=best|align=right|salign=R||bgcolor=#FFF5F5</flash> | |||
[[ | * The QT interval should be corrected for the heart rate, as the QT interval shortens with increasing heartrate. | ||
* Bazetts formula: [[Image:Formule QTc.png]], can be used to calculate the QTc: the heart rate corrected QT. When entering the formula the RR interval should be entered in seconds. The preceding RR interval should be used. You can also use this [[QTc calculator]] | |||
* Preferably one uses the average of several QTc measurements | |||
{{clr}} | {{clr}} | ||
== | ===Examples=== | ||
[[Image:lastigeQT1.png|thumb| The T wave is broad, but the tangent crosses the baseline before the T wave joins the baseline. The QT interval would be overestimated when this last definition of the end of the T wave would be used.]] | |||
[[Image:lastigeQT2.png|thumb| The ECG does not meet the baseline after the end of the T wave. Still, the crossing of the tangent and baseline should be used for measurements.]] | |||
[[Image:lastigeQT3.png|thumb| A bifasic T wave. The tangent to the 'hump' with the largest amplitude is chosen. This can change from beat to beat, making it more important to average several measurements.]] | |||
==References== | |||
<biblio> | <biblio> | ||
#Lepeschkin pmid=14954534 | #Lepeschkin pmid=14954534 | ||
</biblio> | </biblio> | ||
Latest revision as of 21:57, 9 December 2007
| Author(s) | P.G. Postema, MD | |
| Moderator | P.G. Postema, MD | |
| Supervisor | ||
| some notes about authorship | ||

Dr Surawicz, is one of the inventors of the tangent mehod[1]. This picture was taken in November 2006, when he was 89 years old and still active.
The ST segment can present itself in many variants and sometimes this makes it difficult to determine the end of the QT interval. Here you will find some examples of 'difficult' QT segments and how the measure them.
Some controversy exists among cardiologists about when the end of the T wave. Lepeschkin was the first to describe the tangent method that is described in this chapter, and which is addored by most QT specialists.[1] Others allways measure the end of the T wave where it rejoins the baseline, which will often result in longer QT intervals.
General considerations
- The QT interval should be measured in lead II, because the influence of a possible U-wave are smallest in this lead. If lead II is cannot be used for measurements, than leads V4 or V5 can be used alternatively.
- Draw a line through the baseline. This is the horizontal line between the P wave and QRS complex. If PTa segment depression is present, the T - P segment is used alternatively. If there is baseline drifting, it can be difficult to determine the proper baseline and measurements will be less accurate.
- Draw a tangent against the steepest part of the end of the T wave. If the T wave has two humps (as in a camel back), the tallest hump should be picked. If the T wave has a positive and negative hump (or the other way around), the hump with the largest amplitude should be picked (see third example, the first hump has the largest amplitude and should be picked to draw the tangent).
- The QT interval starts at the beginning of the QRS complex: the beginning of the first deflection (either positive of negative) of the QRS complex.
- The QT interval ends where the tangent and the baseline cross.
- The QT interval is the time in milliseconds between the start and end of the QT interval.
- If the QRS interval exceeds 120 milliseconds, than some specialists advice to deduct the amount of milliseconds that exceed 120 ms from the QT interval (i.e. if QRS is 140 ms and QT is 480, then 20ms (i.e. 140 - 120ms) should be deducted from the QT interval, yielding 460ms).
QTc is the heart rate corrected QT interval
<flash>file=QTc.swf|width=300|height=200|quality=best|align=right|salign=R||bgcolor=#FFF5F5</flash>
- The QT interval should be corrected for the heart rate, as the QT interval shortens with increasing heartrate.
- Bazetts formula:
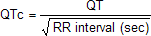 , can be used to calculate the QTc: the heart rate corrected QT. When entering the formula the RR interval should be entered in seconds. The preceding RR interval should be used. You can also use this QTc calculator
 - Preferably one uses the average of several QTc measurements


