Difficult QT: Difference between revisions
Jump to navigation
Jump to search
mNo edit summary |
No edit summary |
||
| Line 1: | Line 1: | ||
{{authors| | {{authors| | ||
|mainauthor= [[user:Pgpostema|P.G. Postema, MD]] | |mainauthor= [[user:Pgpostema|P.G. Postema, MD]] | ||
| Line 8: | Line 7: | ||
}} | }} | ||
__NOTOC__ | __NOTOC__ | ||
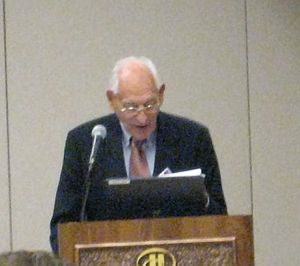
[[Image:Surawicz.jpg|thumb| Dr Surawicz, is one of the inventors of the tangent mehod<cite>Lepeschkin</cite>. This picture was taken in November 2006, when he was 89 years old and still active.]] | |||
The ST segment can present itself in many variants and sometimes this makes it difficult to determine the end of the QT interval. Here you will find some examples of 'difficult' QT segments and how the measure them. | |||
[[Image:Surawicz.jpg|thumb| Dr Surawicz, | |||
Some controversy exists among cardiologists about when the end of the T wave. Lepeschkin was the first to describe the tangent method that is described in this chapter, and which is addored by most QT specialists.<cite>Lepeschkin</cite> Others allways measure the end of the T wave where it rejoins the baseline, which will often result in longer QT intervals. | |||
=== | ===General considerations=== | ||
* | * The QT interval should be measured in lead II, because the influence of a possible U-wave are smallest in this lead. If lead II is cannot be used for measurements, than leads V4 or V5 can be used alternatively. | ||
* | * Draw a line through the baseline. This is the horizontal line between the P wave and QRS complex. If PTa depression is present, the T - P segment is used alternatively. If there is baseline drifting, it can be difficult to determine the proper baseline and measurements will be less accurate. | ||
* | * Draw a tangent against the steepest part of the end of the T wave. If the T wave has two humps (as in a camel back), the tallest hump should be picked. If the T wave has a positive and negative hump (or the other way around), the hump with the largest amplitude should be picked (see third example, the first hump has the largest amplitude and should be picked to draw the tangent). | ||
* | * The QT interval starts at the beginning of the QRS complex: the beginning of the first deflection (either positive of negative) of the QRS complex. | ||
* | * The QT interval ends where the tangent and the baseline cross. | ||
* | * The QT interval is the time in milliseconds between the start and end of the QT interval. | ||
* If the QRS interval exceeds 120 millisseconds, than some specialists advice to deduct the amount of milliseconds that exceeds 120 | |||
Revision as of 14:01, 27 July 2007
| Author(s) | P.G. Postema, MD | |
| Moderator | P.G. Postema, MD | |
| Supervisor | ||
| some notes about authorship | ||

Dr Surawicz, is one of the inventors of the tangent mehod[1]. This picture was taken in November 2006, when he was 89 years old and still active.
The ST segment can present itself in many variants and sometimes this makes it difficult to determine the end of the QT interval. Here you will find some examples of 'difficult' QT segments and how the measure them.
Some controversy exists among cardiologists about when the end of the T wave. Lepeschkin was the first to describe the tangent method that is described in this chapter, and which is addored by most QT specialists.[1] Others allways measure the end of the T wave where it rejoins the baseline, which will often result in longer QT intervals.
General considerations
- The QT interval should be measured in lead II, because the influence of a possible U-wave are smallest in this lead. If lead II is cannot be used for measurements, than leads V4 or V5 can be used alternatively.
- Draw a line through the baseline. This is the horizontal line between the P wave and QRS complex. If PTa depression is present, the T - P segment is used alternatively. If there is baseline drifting, it can be difficult to determine the proper baseline and measurements will be less accurate.
- Draw a tangent against the steepest part of the end of the T wave. If the T wave has two humps (as in a camel back), the tallest hump should be picked. If the T wave has a positive and negative hump (or the other way around), the hump with the largest amplitude should be picked (see third example, the first hump has the largest amplitude and should be picked to draw the tangent).
- The QT interval starts at the beginning of the QRS complex: the beginning of the first deflection (either positive of negative) of the QRS complex.
- The QT interval ends where the tangent and the baseline cross.
- The QT interval is the time in milliseconds between the start and end of the QT interval.
- If the QRS interval exceeds 120 millisseconds, than some specialists advice to deduct the amount of milliseconds that exceeds 120
Het corrigeren van de QT-tijd voor de hartfrequentie.
- De QT-tijd wordt vaak gecorrigeerd voor de hartfrequentie omdat bij een hogere hartfrequentie de QT-tijd korter moet worden, dit heet de QTc-tijd (corrected QT time)
- Wanneer je zo precies mogelijk de QT-tijd wilt vaststellen gebruik je Bazett's formule:
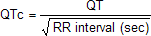 , waarbij het RR interval in seconden (!) wordt gegeven. Daarbij gebruik je de QT tijd van een complex samen met het RR interval van dat complex en het voorafgaande complex.
 - Bovendien gebruik je het liefst het gemiddelde van drie gecorrigeerde QT tijden.
- Bereken hier de QTc:<flash>file=QTc.swf|width=200|height=135|quality=best|align=right|bgcolor=#FFF5F5</flash>
Voorbeelden


Referenties
- LEPESCHKIN E and SURAWICZ B. The measurement of the Q-T interval of the electrocardiogram. Circulation. 1952 Sep;6(3):378-88. DOI:10.1161/01.cir.6.3.378 |
<analytics uacct="UA-807577-6"></analytics>