File:E0003146.jpg

Original file (3,004 × 1,130 pixels, file size: 510 KB, MIME type: image/jpeg)
Summary
| Description |
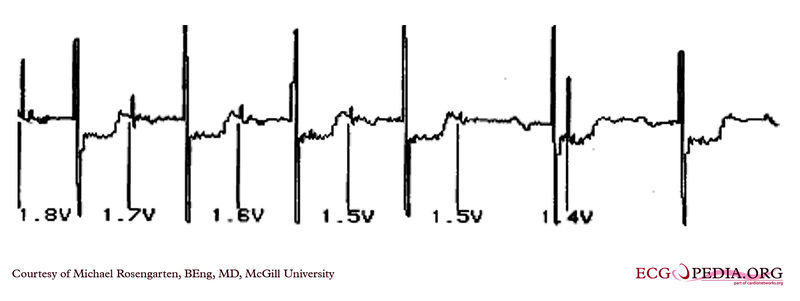
The cardiogram illustrates the determination of the atrial capture threshold. The pacemaker is decrementing down the atrial amplitude as marked below the atrial pacer spikes. note the loss of atrial capture after the second spike of 1.5 volts. Loss of capture is illustrated by three events, 1) the lack of a p wave after the spike, 2) the appearance of a native p wave after the failure to capture and 3) the change in the RR intervals as the QRS is no longer following the paced P wave. The lack of capture after the second 1.5 volt complex illustrates a component of time dependent capture where after a while a stimulus may fail to capture even thought the amplitude is kept constant. |
|---|---|
| Category | |
| Source |
EKG World Encyclopedia http://cme.med.mcgill.ca/php/index.php , courtesy of Michael Rosengarten BEng, MD.McGill |
| Date |
2012 |
| Author |
Michael Rosengarten BEng, MD.McGill |
| Permission |
Creative Commons Attribution Noncommercial Share-Alike License |
File history
Click on a date/time to view the file as it appeared at that time.
| Date/Time | Thumbnail | Dimensions | User | Comment | |
|---|---|---|---|---|---|
| current | 22:47, 18 February 2012 | 3,004 × 1,130 (510 KB) | DarrelC (talk | contribs) |
You cannot overwrite this file.
File usage
The following page uses this file: